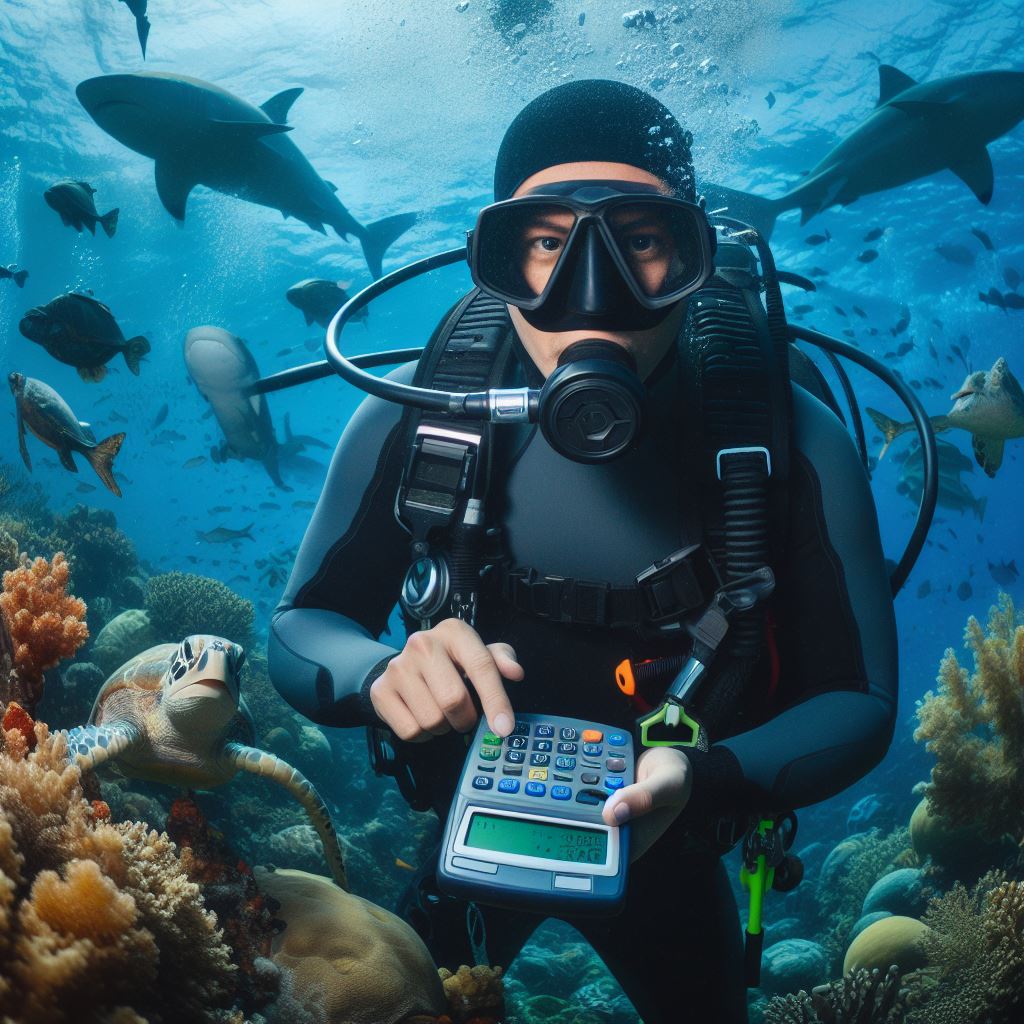
Diving into underwater research, calculators play a pivotal role in analyzing water quality indices. From measuring pH levels to assessing dissolved oxygen concentrations, these tools streamline data analysis for marine scientists. In this article, we’ll explore how calculators aid in deciphering crucial parameters in underwater research. We’ll shed light on the health of aquatic ecosystems and how these tools contribute to guiding conservation efforts effectively.
Underwater research has provided guidance and opportunities for original researches to be conducted in the field of subtidal marine ecology. The research has been devoted particularly to the physiological process and limits of breathing gas under pressure. It has also helpef for aquanaut and astronaut training as well as for research on marine ecology.
Water quality index (WQI) is a means by which water quality data is summarized for reporting to the public in a consistent manner. It is similar to UV index or air quality index. Water quality index, as an area of activity under underwater research, is a 100-point scale that summarizes results from a total of nine different measurements when complete. These nice factors which includes, dissolved oxygen, fecal coliform, PH, biochemical oxygen demand, temperature change, total phosphate, nitrates, turbidity and total solids, are chosen and some judged more important than the other, after which a weighted mean is used to combine the values.
Read more: How to Calculate and Solve for Entropy of Water | Enthalpy
Calculators in Underwater Research for Water Quality Index
The updated calculator used for this computation allows one to enter the longitude and latitude for the site under consideration. Alternatively, it also allows one to pick a location from a Google earth map. The calculator completes the individual and group calculations of the aforementioned factors under consideration. Additionally, it allows you one to generate a customized report.
The water quality index has a legend for grading range of values gotten at the final stage of each computation. This suggests the state of water falling between each range. The six widely used legends are excellent, very good, good, fair, marginal and poor.

The excellent legend, ranging from 95-100,suggests that water quality is protected with a virtual absence of impairment; conditions are close to pristine levels. The index values can only be obtained if all measurements meet recommended guidelines virtually all the time.
Moreover, the very good legend, ranging from 89-94, suggests that water quality is protected with a slight presence of impairment. Hence, conditions are close to pristine levels.
The good legend, ranging from 80-88 suggests that water quality is protected with only a minor degree of impairment; conditions sometimes depart from desirable levels.
The marginal legend, ranging from 45-64,suggests that water quality is frequently impaired; conditions often depart from desirable levels.
Finally, the poor legend, ranging from 0-44,suggests that water quality is always impaired and usually departs from desirable levels.
The use of calculator in underwater research, in this regard, have proven to be result efficient, precise and prompt, regardless of specifications and locations under consideration or intended to be considered, computing individually and in a group values of several factors put under consideration which would have been prone to error if done otherwise.


